

Air France Marketing: R Analysis
By: Michelle Kae Celine Jo-anne Bantugon
Business case built by Professor Chase Kusterer and Dr. Priyanka Shrivastava
Hult International Business School
Introduction
We currently live in a fast paced world and thanks to advancing technologies the consumer has access to products and services in a way that has never been seen before. This has changed the way companies reach out and how they wish to be perceived, specially in the digital world, where it’s difficult to stand out in an ocean of information and competitors.
This challenges companies to elaborate effective strategies towards creating an impactful brand and differentiate themselves while minimizing costs. The following are three actionable insights Team 7 has been able to identify within the study case.
Top Three Actionable Insights
The Overture Global campaign, while having lower CPT and CPC, experiences lower conversion rates and revenue. To improve performance, the campaign should use more “advanced” and explore “broad” keyword match types. Additionally, lowering search engine bids for Overture Global and increasing bids for Overture US could be beneficial. Despite it, it ranks second in clicks and traffic generation, the conversion rate remains low. Utilizing more advanced and broad keywords could enhance this campaign’s performance.
While MSN US and MSN Global have lower traffic compared to Yahoo, they show a higher conversion rate. To boost revenue for the Air France Brand & French Destinations campaign using Google Global and MSN, consider increasing MSN’s search engine bids slightly while decreasing CPC. Using more broad match keywords can also help increase revenue by improving quality score and achieving higher ad ranks. Once stability and awareness are established, advanced and standard keywords can be introduced. Google Global can also benefit from reducing CPC and increasing the use of broad keywords, with future plans for advanced and standard keywords once stability and awareness are achieved.
Geo-targeted countries in both Yahoo US and Google US exhibit high Cost Per Click (CPC) following the Business Class campaign. This indicates a high expenditure for traffic without significant click-through rates (CTR). The low Return On Ad Spent (ROAS) is also indicative of this inefficiency. The campaign targets demographics interested in cost-effective, discounted deals, leading to competitive keyword searches and higher CPCs. Increased competition drives up bid prices, necessitating strategic keyword selection, competition monitoring, and enhanced quality score to lower CPC and boost ROAS and CTR (Semrush, 2023). Quality score is influenced by factors like expected CTR, ad relevance, and landing page experience. Ensuring content alignment with ad promises and optimizing page speed on desktop and mobile devices are essential for enhancing landing page experience (UDS, 2023).
Conclusion
In conclusion, although there exist many paths a campaign or strategy can take to achieve success in its goals, understanding consumer behavior is essential for taking the best actionable course, specially in digital platforms. The competitive nature of it requires knowing as best as possible when a window of opportunity is open for a target demographic and being able to introduce provide better prices for top quality services or products. Moreover, the correct identification of keywords can directly guide towards reaching the established objective, be it bringing more awareness towards the brand or perhaps convince the customer to take action by purchasing tickets offered by Air France. Also, it’s equally important to consider the seasonality of the traveling industry when establishing campaigns because this is a factor that will determine the price of tickets for certain destination because of increasing or decreasing demand. When campaigns are timed well with the fluctuation of purchases it can impact directly the costs to incur, which in turn can assist in providing better pricing.
Part I. Library, Data Import, Cleaning, and Imputation
Installation of packages
#installed.packages("dplyr")
#installed.packages("tidyr")
#installed.packages("tidytext")
#installed.packages("wordcloud2")
#installed.packages("ggplot2")
#installed.packages("RColorBrewer")
#installed.packages("scales")
#install.packages("patchwork")

# Libraries
library(dplyr)           # For data manipulation and summarization

library(tidyr)           # For data tidying and reshaping
library(tidytext)        # For text mining and analysis

library(wordcloud2)      # For creating word clouds
library(ggplot2)         # For data visualization using ggplot

library(RColorBrewer)    # For creating custom color palettes
library(scales)          # For customizing scale options in ggplot
library(patchwork)       # For combining multiple plots into one

# Setting the directory
getwd()

setwd("C:_____")

# Data Importing and Loading
case <- read.csv('case_data.csv',na.strings = c("", "NA", "N/A"))

# Checking the head and structure of the dataset
head(case, 5)
Checking the structure
# Checking thestructure  of the dataset
str(case)
Checking column names
# Checking column names
colnames(case)

# Counting the total missing values per column
colSums(is.na(case))
Renaming columns
# Renaming columns
colnames(case) <- c("Entry_ID", "Publisher_Name", "Keyword", "Match_Type", "Campaign", "Keyword_Group",
                    "Category", "Bid_Strategy", "Status", "Search_Engine_Bid", "Clicks", "Click_Charges",
                    "Avg_Cost_per_Click", "Impressions", "Engine_Click_Thru", "Avg_Pos", "Trans_Conv",
                    "Total_Cost_per_Trans", "Amount", "Total_Cost", "Total_Volume_Bookings")

# Removing special characters in Publisher Name
case$Publisher_Name <-gsub(" - ","_",case$Publisher_Name)

# Removing special characters, comma in each column
case$Search_Engine_Bid <-gsub("\\$","",case$Search_Engine_Bid)
case$Click_Charges <-gsub("\\$","",case$Click_Charges)
case$Click_Charges <-gsub(",","",case$Click_Charges)
case$Clicks <-gsub(",","",case$Clicks)
case$Impressions <-gsub(",","",case$Impressions)
case$Avg_Cost_per_Click <-gsub("\\$","",case$Avg_Cost_per_Click)
case$Engine_Click_Thru <-gsub("\\%","",case$Engine_Click_Thru)
case$Trans_Conv <-gsub("\\%","",case$Trans_Conv)
case$Total_Cost_per_Trans <-gsub("\\$","",case$Total_Cost_per_Trans)
case$Total_Cost_per_Trans <-gsub(",","",case$Total_Cost_per_Trans)
case$Amount <-gsub(",","",case$Amount)
case$Amount <-gsub("\\$","",case$Amount)
case$Total_Cost <-gsub("\\$","",case$Total_Cost)
case$Total_Cost <-gsub(",","",case$Total_Cost)

# Changing data type from character to numeric
case$Search_Engine_Bid <-as.numeric(case$Search_Engine_Bid)
case$Clicks <-as.numeric(case$Clicks)
case$Click_Charges <-as.numeric(case$Click_Charges)
case$Avg_Cost_per_Click <-as.numeric(case$Avg_Cost_per_Click)
case$Impressions <-as.numeric(case$Impressions)
case$Engine_Click_Thru <-as.numeric(case$Engine_Click_Thru)
case$Avg_Pos <-as.numeric(case$Avg_Pos)
case$Trans_Conv <-as.numeric(case$Trans_Conv)
case$Total_Cost_per_Trans <-as.numeric(case$Total_Cost_per_Trans)
case$Amount <-as.numeric(case$Amount)
case$Total_Cost <-as.numeric(case$Total_Cost)

# Checking the structure
str(case)
Checking Statistics
# Checking the statistics and spotting outliers
summary(case)
Imputation
# To ensure data accuracy, character-based continuous variables were converted to numeric types, special
# characters were removed, and columns were renamed.

# In the dataset, anomalies are observed in Engine Click-Thru and Transaction Conversion rates, with outliers
# reaching 200% and 900% respectively. These outliers should be addressed by removing them from the dataset.
# Despite the majority of bookings being zero, it's noteworthy that one search engine attracted 439 bookings.
# Additionally, some publishers show competitive search engine bid tendencies, with the maximum bid reaching
# $27.50, correlating with high click charges totaling $46,188.

# Removing outliers in Trans_Conv (Conversion Rate)

case <- case %>% filter(!Trans_Conv == 900)

# Removing outliers in Engine_Click_Thru
case <- case %>% filter(Engine_Click_Thru != 120 & Engine_Click_Thru != 200)

# Imputation on Match Type

# Imputation on Match Type

# Changing the "N/A" string to Unknown in Match Type column
case$Match_Type[is.na(case$Match_Type)] <- "Unknown"

# Imputation on Bid Strategy
case$Bid_Strategy <- ifelse(case$Publisher_Name == "Yahoo_US" & is.na(case$Bid_Strategy), "Position 2-5 Bid Strategy",
                                    ifelse(case$Publisher_Name == "Google_Global" & case$Category == "uncategorized" & is.na(case$Bid_Strategy), "Position 1-3 Bid Strategy",
                                           ifelse(case$Publisher_Name == "Google_US" & case$Match_Type == "Exact" & is.na(case$Bid_Strategy), "Position 5-10 Bid Strategy",
                                                  ifelse(case$Publisher_Name == "Google_US" & case$Match_Type == "Broad" & case$Campaign == "Air France Branded" & case$Keyword_Group == "Air France Website" & is.na(case$Bid_Strategy), "Position 1-4 Bid Strategy",
                                                         ifelse(case$Publisher_Name == "Google_US" & case$Match_Type == "Broad" & case$Campaign == "Air France Branded" & case$Keyword_Group == "Air France Brand" & is.na(case$Bid_Strategy), "Position 5-10 Bid Strategy",
                                                                ifelse(case$Publisher_Name == "Google_US" & case$Match_Type == "Broad" & case$Campaign == "Paris & France Terms" & case$Keyword_Group == "Paris Xpress" & is.na(case$Bid_Strategy), "Position 5-10 Bid Strategy",
                                                                       ifelse(case$Publisher_Name == "Google_US" & case$Match_Type == "Broad" & case$Campaign == "Geo Targeted New York" & case$Keyword_Group == "Air France Brand" & is.na(case$Bid_Strategy), "Position 5-10 Bid Strategy",
                                                                              ifelse(case$Publisher_Name == "Google_US" & case$Match_Type == "Unknown" & case$Campaign == "Google_Yearlong 2006" & case$Category == "uncategorized" & is.na(case$Bid_Strategy), "Position 5-10 Bid Strategy",
                                                                                     ifelse(case$Publisher_Name == "MSN_US" & case$Campaign == "Air France Brand & French Destinations" & is.na(case$Bid_Strategy), "Position 2-5 Bid Strategy",
                                                                                            ifelse(case$Publisher_Name == "MSN_US" & (case$Campaign == "Business Class" | case$Campaign == "Geo Targeted Seattle") & is.na(case$Bid_Strategy), "Position 2-5 Bid Strategy",
                                                                                                   ifelse(case$Publisher_Name == "Overture_Global" & is.na(case$Bid_Strategy), "Position 1-2 Bid Strategy",
                                                                                                          ifelse(case$Publisher_Name == "Overture_US" & case$Match_Type == "Standard" & (case$Category == "airfrance" | case$Category == "bordeaux") & is.na(case$Bid_Strategy), "Position 1-4 Bid Strategy",
                                                                                                                 case$Bid_Strategy))))))))))))


# Checking if all null values are imputed
colSums(is.na(case))
Imputation rationale
Bid strategy imputation was guided by patterns observed within each publisher name’s data, alongside considerations of which campaign they belong, their search engine bid for that specific campaign, and keyword group to maintain dataset consistency. Prior to imputation, data cleaning involved correcting typographical errors in bid strategy values to facilitate merging of similar values, particularly for Position 1-4 Bid Strategy. “N/A,” considered a valid match type, was changed to “Unknown” to avoid it being recognized as a null value by R. Uniformity and consistency were ensured throughout this process.
Adding new column (ROAS and Net Revenue)
# Adding Return On Advetising Spent(ROAS) column
case$ROAS <- case$Amount / case$Total_Cost

# Adding Net Revenue column
case$Net_Revenue<- case$Amount - case$Total_Cost
NLP (Word Cloud)
# NLP
text_data <- case
# Convert the 'Keyword' column to UTF-8 encoding
text_data$Keyword <- iconv(text_data$Keyword, to = "UTF-8", sub = "byte")
# Remove punctuation, numbers, and stopwords from the 'Keyword' column
text_data$Keyword <- gsub("[^a-zA-Z\\s]", "", text_data$Keyword) # Remove punctuation
text_data$Keyword <- gsub("\\b\\d+\\b", "", text_data$Keyword) # Remove numbers
text_data$Keyword <- gsub("\\b(?:the|and|or|of|to|a|in)\\b", "", text_data$Keyword, ignore.case = TRUE)
# Trim whitespace
text_data$Keyword <- trimws(text_data$Keyword)
# Tokenization
tidy_text <- text_data %>%
mutate(row = row_number()) %>%
unnest_tokens(word, Keyword)
# Remove Stop Words
tidy_text <- tidy_text %>%
anti_join(stop_words, by = "word")
# Word Frequency
word_freq <- tidy_text %>%
count(word, sort = TRUE)
# Generating Wordcloud
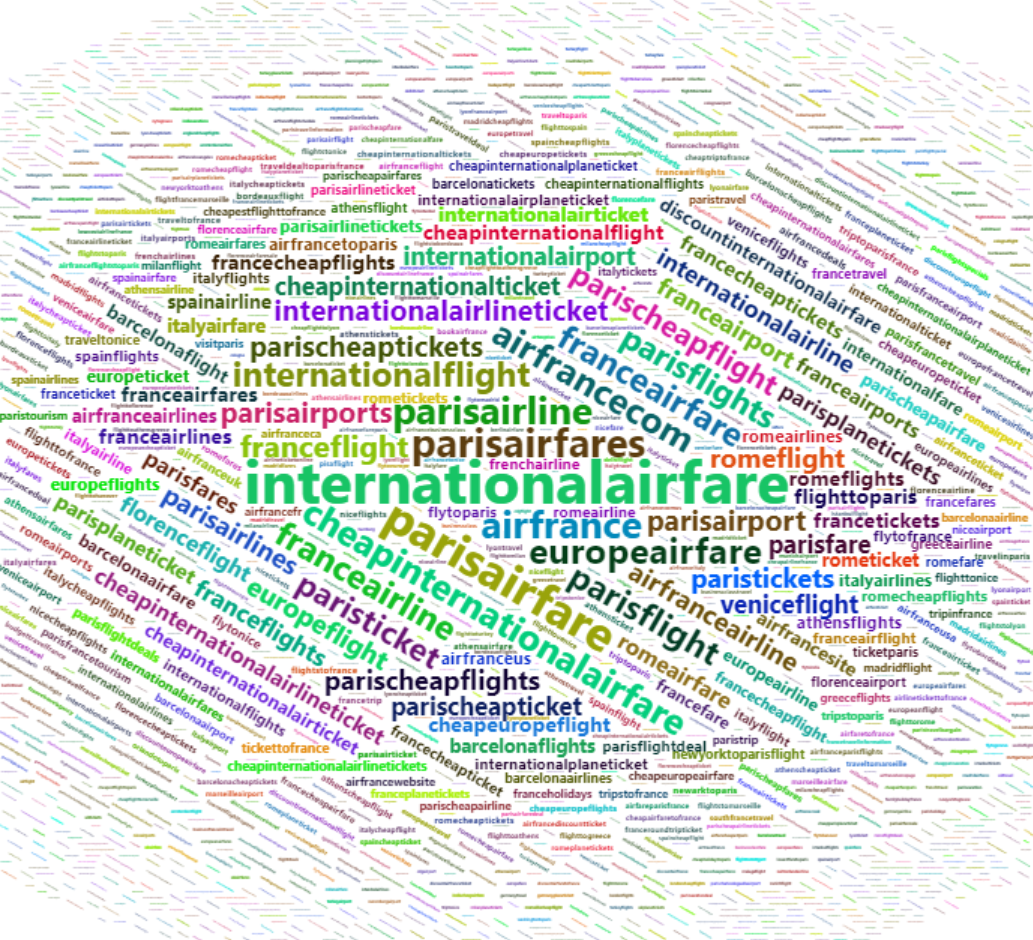
wordcloud2(word_freq, size = .22, minRotation = -pi/6, maxRotation = -pi/6)
Analysis on Word Cloud
The plot indicates that the most frequent keyword is “internationalairfare,” suggesting a focus on international flights rather than domestic travel specifically in terms of airfare. The next frequent terms are parisairfare, parisairfares and parisflight. This suggests a strong preference for travel to Paris among users. While Paris is the primary focus, keywords like europeairfare, franceairfare, romeflight, and veniceflight suggest an interest in other European cities as well.
The keywords airfrance, airfrancecom, and airfranceairline show that users refer to specifically search for information about Air France’s services directly on their website. Other keywords such as cheapinternationalairfare, parischeapflight, and cheapinternationalticket suggest that customers are looking for an affordable travel options.
Part III. Our Strategy & Reverse Marketing Funnel
Visualization of Top Keywords
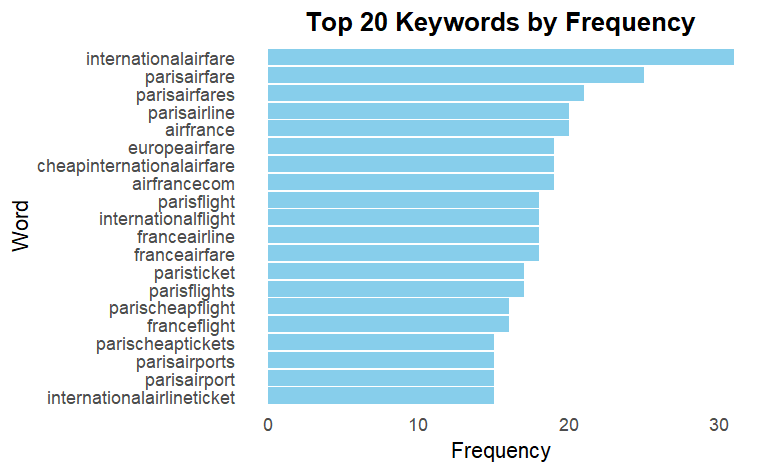
# Displaying the top 20 keywords by frequency
ggplot(word_freq[1:20, ], aes(x = reorder(word, n), y = n)) +
  geom_bar(stat = "identity", fill = "skyblue") +
  coord_flip() +
  labs(x = "Word", y = "Frequency", title = "Top 20 Keywords by Frequency") +
  theme_minimal() +
  theme(
    panel.grid.major = element_blank(),  # Remove major gridlines
    panel.grid.minor = element_blank(),  # Remove minor gridlines
    plot.title = element_text(hjust = 0.5, face = "bold")
  )
Analysis of Top 20 Keywords by Frequency
In addition to creating a word cloud, presenting a bar plot of the most frequent keywords would provide the audience with a clear and straightforward visualization. We will analyze the top 20 keywords to understand their frequency and performance in Air France’s SEM campaigns. This selection represents the most frequently used words, with a maximum frequency of 31 down to 15. We will use these keywords to assess their association with the top-performing campaigns of Air France. Additionally, we will identify any keywords not in the top 20 that perform well based on our key performance indicators (KPIs) and determine their associated campaigns and strategies.
Part IV. Data Visualizations and Analysis
# Create a vector of the top keywords with high frequency (15 to 31)
top_words <- c("international air fare", "international airfare", "paris airfare",
               "paris air fare", "paris airfares", "paris air fares",
               "[airfrance]", "airfrance", "[air france]", "air france",
               "paris airline", "air france com", "airfrance com",
               "cheap international airfare", "cheap international air fare",
               "europe airfare", "europe air fare", "france air fare",
               "france airfare", "france air line", "france airline",
               "international flight", "paris flight", "paris flights",
               "paris ticket", "france flight", "paris cheap flight",
               "international airline ticket","international air line ticket",
               "paris airport", "paris airports", "paris cheap tickets",
               "airfrance airline", "air france airline", "europe flight",
               "rome flight", "cheap international ticket", "venice flight",
               "florence flight", "venice flight", "barcelona flight")

# Filter and sort the dataframe
top_20_matched <- case %>%
  filter(Keyword %in% top_words) %>% # Filter rows where Keyword matches any of the top words
  arrange(desc(Total_Volume_Bookings), desc(Clicks), desc(Impressions), Avg_Cost_per_Click)
STRATEGY
We utilize the marketing funnel in this case study dataset which is the model of the customer journey. It represents the buying stages people go through after becoming aware of a business, service, or product (Semrush, 2023).The funnel starts with “Awareness”, “Consideration”, “Conversion”, and “Loyalty”. This shows the customers narrowing as the journey progresses toward purchase. From this marketing funnel, we decided to create our strategy which is to reverse it. We want to create a lookalike audiences to reverse the marketing funnel and generate high-quality leads. This is aligned with the study of Naira Perez (2022) who is now using the social media platforms to help us create personas based on data we know is accurate and then targeting them. According to Perez(2022), interest-based marketing is a good starting point but misses the mark many times. In one of the study conducted on the accuracy of Facebook activity on their interest-based ads, they found that only 30% of interests Facebook listed were not real interests. This means that if your ad is based on the list of interests, you could miss the mark about 30% of the time. With this reverse marketing funnel, instead of feeding this theoretical funnel to cold audiences, we want to go first at the end of the funnel and generate a list of cold audiences so similar to our current converters that they may be almost considered warm audiences. As Perez (2022) recommended, with this strategy we need to consider our campaign more competitive in a way that the goal for lookalike audiences is not only to be good at converting but also at engagement. This means they will also spread awareness to other potential lookalike audiences.
Our KPIs in Reverse Marketing Funnel
This model is in perspective of maximizing the return on investment (ROI) but at the same time retaining customers, and lowering the cost. Our model will start on “Total Number of Booking” which is the part of “Conversion and Loyalty”. It will be followed by “Clicks” which will be represented by “Consideration” then “Impression” which in this case is “Awareness”. Finally, the “Average Cost per Click” is also considered to minimize the cost impact.
As per Wordstream, quality Score has a direct correlation on success in Google Ads and Microsoft Ads which means higher ROI. High quality scores lower both the cost per click and the cost per conversion. Moreover, it can also improve the ad position that increases the likelihood of customers clicking on the ads.
Results of Reverse Marketing Funnel using the dataset
The table shows that the first top 20 of the top performing campaigns who are the “Air Branded” and “Air France Brand & French Destinations”. The most relevant keywords results are airfrance, air france, [airfrance], and airfrance com. While “Exact” match type topped the ranking, majority of match type is “Broad” with few “Advanced” as well. For the publisher name, there are several who make it to the top which comprises of “Google_US”, “Google_Global”, “Yahoo_US”, “MSN_US”, and “Overture_Global”.
# Creating and arranging the dataframe based on our strategy
ranked <- case %>%
  arrange(desc(Total_Volume_Bookings), desc(Clicks), desc(Impressions), Avg_Cost_per_Click)
Case Study Visualization and Analysis & Q1
# Average Cost per Click Plot by Publisher Name
cpc_plt <- ggplot(ranked, aes(x = Publisher_Name, y = Avg_Cost_per_Click, fill = Publisher_Name)) +
  geom_boxplot() +
  labs(title = "Average CPC by Publisher Name",
       x = "Publisher Name",
       y = "Average Cost per Click") +
  theme_minimal() +
  theme(
    axis.text.x = element_text(angle = 40, hjust = 1),
    axis.title = element_text(size = 12),
    plot.title = element_text(hjust = 0.5, face = "bold", size = 12),
    panel.grid.major = element_blank(),
    panel.grid.minor = element_blank(),
    legend.position = "none"
  ) +
  scale_fill_brewer(palette = "Pastel1") # Use a light color palette from RColorBrewer

# Conversion Rate in Overall Dataset
conversion_overall <- ranked %>%
  group_by(Publisher_Name) %>%
  summarise(Total_Bookings = sum(Total_Volume_Bookings),
            Total_Clicks = sum(Clicks),
            Aggregated_Trans_Conv = Total_Bookings / Total_Clicks * 100)

# Conversion Rate Plot by Publisher Name
conversion_plt<-ggplot(conversion_overall, aes(x = Publisher_Name, y = Aggregated_Trans_Conv,
                                               fill = Publisher_Name)) +
  geom_col() +
  labs(title = "Conversion Rate by Publisher Name",
       x = "Publisher Name",
       y = "Conversion Rate") +
  theme_minimal() +
  theme(axis.text.x = element_text(angle = 40, hjust = 1),
        axis.title = element_text(size = 12),
        plot.title = element_text(hjust = 0.5, face = "bold", size = 12),
        panel.grid.major = element_blank(),
        panel.grid.minor = element_blank(),
        legend.position = "none"
  ) +
  scale_fill_brewer(palette = "Pastel1")

# Total Cost per Transaction
cpt_overall <- ranked %>%
  group_by(Publisher_Name) %>%
  summarise(Total_Cost = sum(Total_Cost),
            Total_Bookings = sum(Total_Volume_Bookings),
            Total_Cost_per_Trans = ifelse(Total_Bookings > 0, Total_Cost / Total_Bookings, 0))

# Total Cost per Transaction by Publisher Name
cpt_plt <-ggplot(cpt_overall, aes(x = Publisher_Name, y = Total_Cost_per_Trans, fill = Publisher_Name)) +
  geom_col() +
  labs(title = "Total Cost per Transaction by Publisher Name",
       x = "Publisher Name",
       y = "Total Cost per Transaction") +
  theme_minimal() +
  theme(axis.text.x = element_text(angle = 40, hjust = 1),
        axis.title = element_text(size = 12),
        plot.title = element_text(hjust = 0.5, face = "bold", size = 12),
        panel.grid.major = element_blank(),
        panel.grid.minor = element_blank(),
        legend.position = "none"
  ) +
  scale_fill_brewer(palette = "Pastel1")

# Custom function to format revenue labels
format_number <- function(x) {
  sapply(x, function(x) formatC(x, format = "f", big.mark = ",", digits = 0, drop0trailing = TRUE))
}

# Net Revenue by Publisher Name
rev_overall <- ggplot(ranked, aes(x = Publisher_Name, y = Net_Revenue, fill = Publisher_Name)) +
  geom_bar(stat = "identity", position = position_dodge()) +
  labs(title = "Net Revenue by Publisher Name",
       x = "Publisher Name",
       y = "Net Revenue") +
  theme_minimal() +
  theme(axis.text.x = element_text(angle = 40, hjust = 1),
        axis.title = element_text(size = 12),
        plot.title = element_text(hjust = 0.5, face = "bold", size = 12),
        panel.grid.major = element_blank(),
        panel.grid.minor = element_blank(),
        legend.position = "none"
  ) +
  scale_fill_brewer(palette = "Pastel1") +
  scale_y_continuous(labels = format_number) # Use custom label formatting

# Match Type by Publisher Name
match_plt <- ggplot(ranked, aes(x = Publisher_Name, fill = Match_Type)) +
  geom_bar(position = "stack") +  # Stack bars by Match_Type
  scale_fill_brewer(palette = "Pastel1") +  # Apply light color palette
  labs(title = "Publisher Name by Match Type",
       x = "Publisher Name",
       y = "Count") +
  theme_minimal() +
  theme(axis.text.x = element_text(angle = 40, hjust = 1),
        axis.title = element_text(size = 12),
        plot.title = element_text(hjust = 0.5, face = "bold", size = 12),
        panel.background = element_blank(),
        panel.grid.major = element_blank(),
        panel.grid.minor = element_blank(),
        legend.position = "right",
        legend.title = element_text(face = "bold"))

# Search Engine Bid by Publisher Name
bid_plt<-  ggplot(ranked, aes(x = Publisher_Name, y = Search_Engine_Bid, fill = Publisher_Name)) +
  geom_boxplot() +
  labs(title = "Distribution of Search Engine Bids by Publisher", x = "Publisher Name", y = "Bid Amount") +
  theme_minimal() +
  theme(axis.text.x = element_text(angle = 40, hjust = 1),
        axis.title = element_text(size = 12),
        plot.title = element_text(hjust = 0.5, face = "bold", size = 12),
        panel.grid.major = element_blank(),
        panel.grid.minor = element_blank(),
        legend.position = "none"
  ) +
  scale_fill_brewer(palette = "Pastel1")

# Visualization Analysis I

# Using the overall data set in the following plots

# Average CPC by Publisher Name (Plot 1)
cpc_plt
Average CPC by Publisher Name (Plot 1)
In our analysis of average cost-per-click (CPC) by publisher, we’ve identified notable variances. Publishers such as Google, MSN, and Yahoo demonstrate a broad CPC range, suggesting varied bidding strategies. Conversely, Overture (both Global and US) exhibits a narrower CPC spread, implying a more uniform pricing approach. Yahoo and Overture, predominantly utilizing standard and advanced match types, typically incur lower CPCs. Meanwhile, Google and MSN, favoring broad match types, are associated with higher CPCs. Notably, Google is the exclusive publisher implementing exact match types within this dataset.
# Conversion Rate by Publisher Name & Publisher Name by Match Type Plots (Plot 2 and 3)
conversion_plt
Case Study Question 3
What are the most important KPIs, and what impact will campaign changes have on these KPIs?
-
Total Volume of Bookings This is a direct measure of campaign success in terms of generating revenue. Campaign changes that better align with customer or user intent and improve ad relevance can increase bookings.
-
Transaction Conversion / Conversion Rate It indicates the percentage of clicks that result in a desired action which is booking a flight. Optimizing landing pages and the customer journey can improve this rate.
-
Click-Through Rate (CTR) This KPI measures the effectiveness of the keywords and ads in generating clicks. Improving the ad copy and leveraging effective keyword per search engine and campaign can increase CTR.
-
Cost Per Click (CPC) A lower CPC can indicate improved efficiency in bidding strategies. Adjustments to bids or utilizing different match types can impact this KPI.
Case Study Question 2
How can campaigns be improved to increase overall value gained from investment with a search engine publisher? Should keywords be added or dropped from the campaign? Should campaign tactics or copy be adjusted to improvecampaign performance?
The match type used by the search engine publishers give insight in how to strategize a more diverse portfolio in order to better capture customers in both ends of their journey, with broad match type keywords resulting in more impressions, and both advanced and standard match type keywords resulting in more conversion rates.
Therefore, future campaigns should aim to increase in advanced and standard keywords for Google to incentivize purchasing in this platform taking advantage of their superior traffic.
On the other hand, it would benefit Air France to increase their campaigns on Yahoo, with broad keywords in order increase impression and attract customers who are beginning their purchasing journey and benefit from the lower CPC.
For campaigns in MSN Global and US, it’s suggested to increase in the three match types mentioned before as they present a great potential for more customers to engage with the ads with lower costs, reaching a less interacted audience.
Case Study Question 4
How should future SEM campaigns be structured? In the past, Media Contacts had concentrated on Google, Microsoft, and Yahoo; was there now an opportunity to optimize search advertising with metasearch companies such as Kayak?
As metasearch companies are becoming more popular, future campaigns can benefit from researching an ideal bidding position according to consumer’s behavior, where the reduced cost can assist in establishing a better price listing for the tickets and help in differentiating the brand, as researched by Meng (2011). This is to establish a better branding perception that will convince customers a fair price for a high quality service/product is being provided increasing their satisfaction, as seen by Van Doorn & Leeflang (2013). For this reason investing in a determined keyword such as exact or advanced types should be based on when the customers are more likely to purchase tickets and other keywords such broad or standard should me implemented to increase visibility during periods when better prices could be offered. This will help to decrease costs in advertising and ultimately allow for increased relevance in metasearch companies.
References
# References

# Agency Analytics (n.d.). Cost per Acquisition (CPA).
#     https://agencyanalytics.com/kpi-definitions/cost-per-acquisition-cpa

# Chaffey, D., & Ellis-Chadwick, F. (2019). Digital marketing. Pearson uk.

# Lahey, C. (June 2023). The 4 Types of Keywords.
#     https://www.semrush.com/blog/types-of-keywords-commercial-informational-navigational-transactional/
#     2--navigational

# Lyons, K. (July 2023). What Is Cost Per Click (CPC)?.
#     https://www.semrush.com/blog/cost-per-click/#how-to-lower-cpc

# Mankad, D. (2018). Understanding Digital Marketing-Strategies for online success. BPB Publications.

# Meng, J. (2011). Understanding cultural influence on price perception: empirical insights from a SEM
#     application. Journal of Product & Brand Management, 20(7), 526-540.

# Player Zero. (2023). Conversion Rate Vs Acquisition Rate.
#     https://www.playerzero.ai/advanced/product-builder-facts/conversion-rate-vs-acquisition-rate

# Perez, N. (August 2022). Using lookalike audiences to reverse the marketing funnel and generate quality leads.
#     https://searchengineland.com/lookalike-audiences-reverse-marketing-funnel-386922

# Semrush. (n.d). Marketing Funnel.
#     https://www.semrush.com/blog/marketing-funnel/

# Spider AF. 5 Strategies to Optimize Your CPA Performance.
#     https://spideraf.com/media/articles/5-strategies-to-optimize-your-cpa-performance

# UDS Digital Marketing. (October 2023). Google Ads: CPC, CTR, and Conversion Tracking.
#     https://ubiquedigitalsolutions.com/blog/google-ads-cpc-ctr-and-conversion-tracking/

# Van Doorn, J., Leeflang, P. S., & Tijs, M. (2013). Satisfaction as a predictor of future performance:
#     A replication. International journal of research in marketing, 30(3), 314-318.

# WordStream by LocaliQ.(n.d.). What Is Quality Score & How Does it Affect Google Ads?
#     https://www.wordstream.com/quality-score